- BLOG HOME
- »
- Snapshot Reports
- »
- Latest Research Shows 6-Year College Completion Slows Down for Full-Time and Part-Time Students

Latest Research Shows 6-Year College Completion Slows Down for Full-Time and Part-Time Students
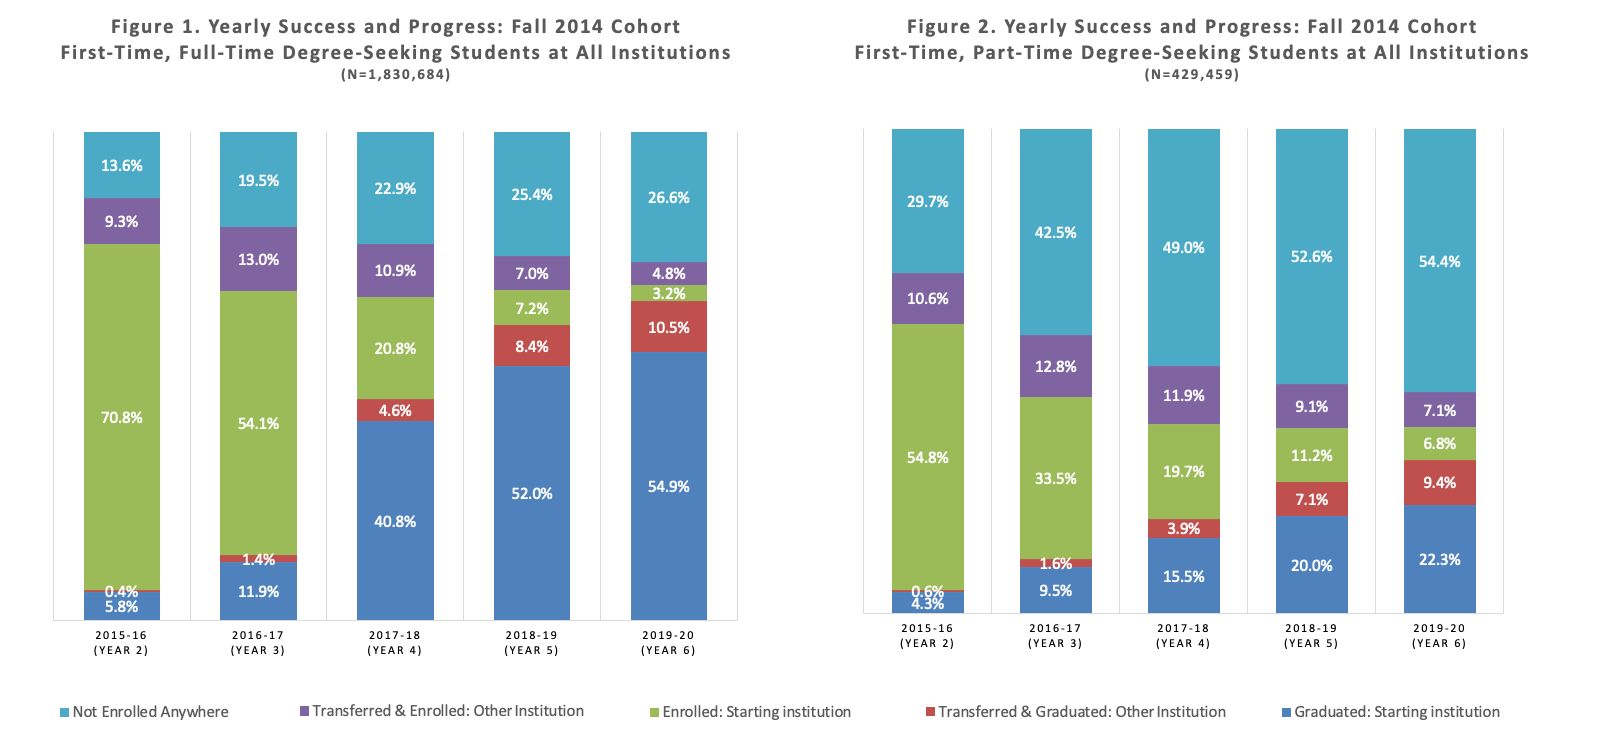
For the latest entering cohort, the steady growth in the six-year college completion rate started to slow down for full-time starters, and the rate declined notably for part-time starters, according to the National Student Clearinghouse Research Center’s latest report, Yearly Success and Progress Rates.
Over the past six cohort years starting in 2009, the steady growth in the six-year college completion rate for full-time starters began to slow down in 2014. The 0.6 percentage point gain made by the 2014 cohort is less than half the gains seen in the two previous cohorts. For cohort-to-cohort comparisons, see tab 1 on the data dashboards.
Part-time starters, in contrast, have seen their completion rates decline over the past year after two straight years of improvement. This decline is due to a stop-out rate hike by year two (+5 percentage points). The increase in stop-out rates for part-time beginners is driven primarily by those starting at a community college, who saw their stop-out rates by year two climb 7.8 percentage points over the past year. Furthermore, for those beginning part time at a public four-year college, the stop-out rates by year four have steadily declined over time.
Between full-time and part-time entrants, the gap in stop-out rate has been widening across cohorts. Tab 1 in the report’s data dashboards illustrates the persistence disadvantage in part-time starters; between 2009 and 2014, their stop-out rate increased significantly (44.8% to 54.4% by year six), while this rate declined for full-time starters (29.7% to 26.6%). The data suggests that the retention and persistence disadvantage in students entering part time appears to be worsening.
The Yearly Success and Progress Rates report goes beyond traditional student outcome measures by showing year-by-year rates of retention, persistence, transfer, completion, and stop-out. The report examines yearly academic progress for approximately 2.3 million individuals who began college for the first time in fall 2014. Their yearly progress and success rates can be compared with previous cohorts nationally, and by state, through the interactive data dashboards newly added this year.
The outcome categories are modeled after those used in the Student Achievement Measure (SAM), and can be used as national and state-level benchmarks for institutions participating in SAM. Also, unlike in SAM reporting, undergraduate certificates are counted as completions in this report.
Additional Resources: