- BLOG HOME
- »
- Signature Reports
- »
- Overall College Completion Rate Rises in 43 States; Top-to-Bottom Gap Narrows

Overall College Completion Rate Rises in 43 States; Top-to-Bottom Gap Narrows
California, Georgia, Iowa, Michigan, Nevada, New York, North Carolina, Ohio and Utah Make Significant Improvements
New data described in the National Student Clearinghouse Research Center’s Completing College State Report shows a rise in the overall college completion rate in 43 out of the 45 states, for which data are available over the last five cohort years (2009-2013), and a narrowing of the top-to-bottom state completion rate gaps. Only Alabama and New Hampshire saw declines. To review state-by-state details, download the report’s appendix.
When indexed to the highest completion rate of all states (set at 100), for the 2013 cohort, 25 states were at least at the 80 percent level of the top rate, in comparison to only 13 states for the 2009 cohort. The index score demonstrates a comparison of each state against the top performing state.
The national six-year completion rate reached 59.7% for the 2013 entering cohort, and the eight-year completion rate increased to 61.8% for the 2011 entering cohort, according to the Completing College 2019 National Report.
“Most states saw steady, across-the-board gains in overall completion rates and completion rate disparities among states narrowed, while nearly every state trended upward,” said Doug Shapiro, Executive Director, National Student Clearinghouse Research Center. “Compared to the prior cohort year, community college starters made stronger gains this year than public four-year starters, and some states increased completion outcomes for racial/ethnic minorities at higher rates than overall.”
The states with the largest increases in completion rates over the last five cohort years include: Ohio (53% to 62%), Georgia (52% to 61%), Michigan (51% to 60%), New York (58% to 66%), California (45% to 53%), Utah (41% to 51%), Iowa (60% to 69%), Nevada (29% to 38%), and North Carolina (54% to 62%).
State-Level Highlights:
- New trend data reveals a steady rise in the overall completion rate across states and a narrowing of cross-state disparities.
- While public college completion rates are up generally, those for community college starters appear to be gaining more ground.
- In two states, both Hispanic and African American completion rates improved at higher rates than overall.
- First-time beginning students at community colleges are becoming younger.
The national six-year completion rate reached 59.7% for the 2013 entering cohort, and the eight-year completion rate increased to 61.8% for the 2011 entering cohort, according to the Completing College 2019 National Report.
“With better tracking and disaggregation of data increasingly available to state educational leaders and policy makers through the National Student Clearinghouse Research Center, efforts to improve student success can become more focused,” Shapiro concludes.
In the fall, the Research Center will publish a combined National and State Completing College 2020 report.
Six-Year Completion Rates by Starting Institution Type: 2006-2013 Entering Cohorts
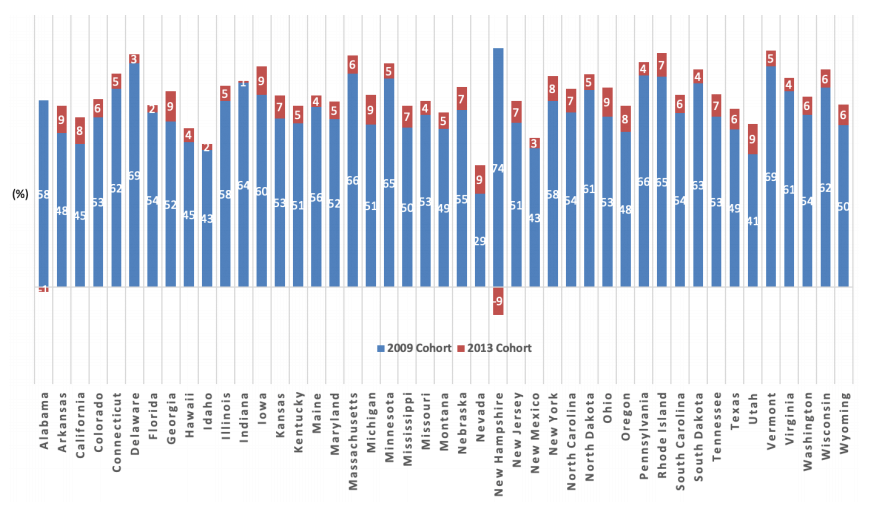
Data are not available for five states that have uneven historical data coverage, Alaska, Arizona, Louisiana, Oklahoma, and West Virginia. Changes between the two cohort years (2009 and 2013) are shown here. Data for all intervening years are available in Table 1 and trends over those years are similar.
“With better tracking and disaggregation of data increasingly available to state educational leaders and policy makers through the National Student Clearinghouse Research Center, efforts to improve student success can become more focused.”
Doug Shapiro
Executive director, National Student Clearinghouse Research Center
Additional Resources: