- BLOG HOME
- »
- Testimonials
- »
- Maricopa Community Colleges: Using PDP for Benchmarking & Addressing College Equity

Maricopa Community Colleges: Using PDP for Benchmarking & Addressing College Equity

Lori Lindenberg District Director of Enterprise Analytics and Strategy, Maricopa Community Colleges
The Clearinghouse’s Postsecondary Data Partnership (PDP) empowers higher education institutions with comprehensive data to help them understand, improve, and communicate student momentum, outcomes, and equity. Arizona’s Maricopa County Community College District, which serves nearly 140,000 students, has shared that it is an essential resource that helps them measure performance and identify equity gaps among their student population.
Lori Lindenberg, District Director of Enterprise Analytics and Strategy, and Meredith Warner, District Director, Student Success at Maricopa Community Colleges, explain how they use PDP data to inform their decisions around college enrollment, completion, retention rates and more.
How has the PDP helped with operational efficiencies and comprehensive analytics solutions?

Meredith Warner District Director, Student Success, Maricopa Community Colleges
One of the areas that has been very important for us is having an in-depth understanding of how we match up with peer institutions to know if we are making progress. We are always looking at how many of our students continue and complete their higher education journey after enrolling in one of our colleges. With 140,000 students, which amounts to a lot of data, Maricopa has always been interested in having a partnership that can enable us to track, measure, and report on these metrics.
Which PDP data have you found the most impactful for Maricopa County Colleges?
The PDP data that has become most impactful for us is the early-term retention data and how we look at first-year success rates for our students. Our leading indicators of student success are driving the work of our Strategic Enrollment Management team and our Integrated Student Success strategy. This data is driving how we are transforming the experience for our students.
For example, we have created first-year experience classes, one for transfer students and one for those new to college, to help ensure they have a successful college career. For Fall 2022, we have more than 300 sections of these courses across our colleges, with over 8,000 students. We will rely on retention data to show the impact of these programs, and without the most current and relevant data, it just would not be possible to tell that story.
What were the top issues in terms of success rates?
When we look at college-level course success, particularly total completion rates, the equitable driver for us is a major focus. We can see that more of our students of color do not place into college-level English and math classes, and if they don’t complete college-level English or math in their first year, they are much less likely to persist to year two. There’s this sense among our traditionally underserved students that they don’t belong, that this is not for them, that college is scary, and that college was not initially designed for them. So, we must create a welcoming space that goes beyond placement.
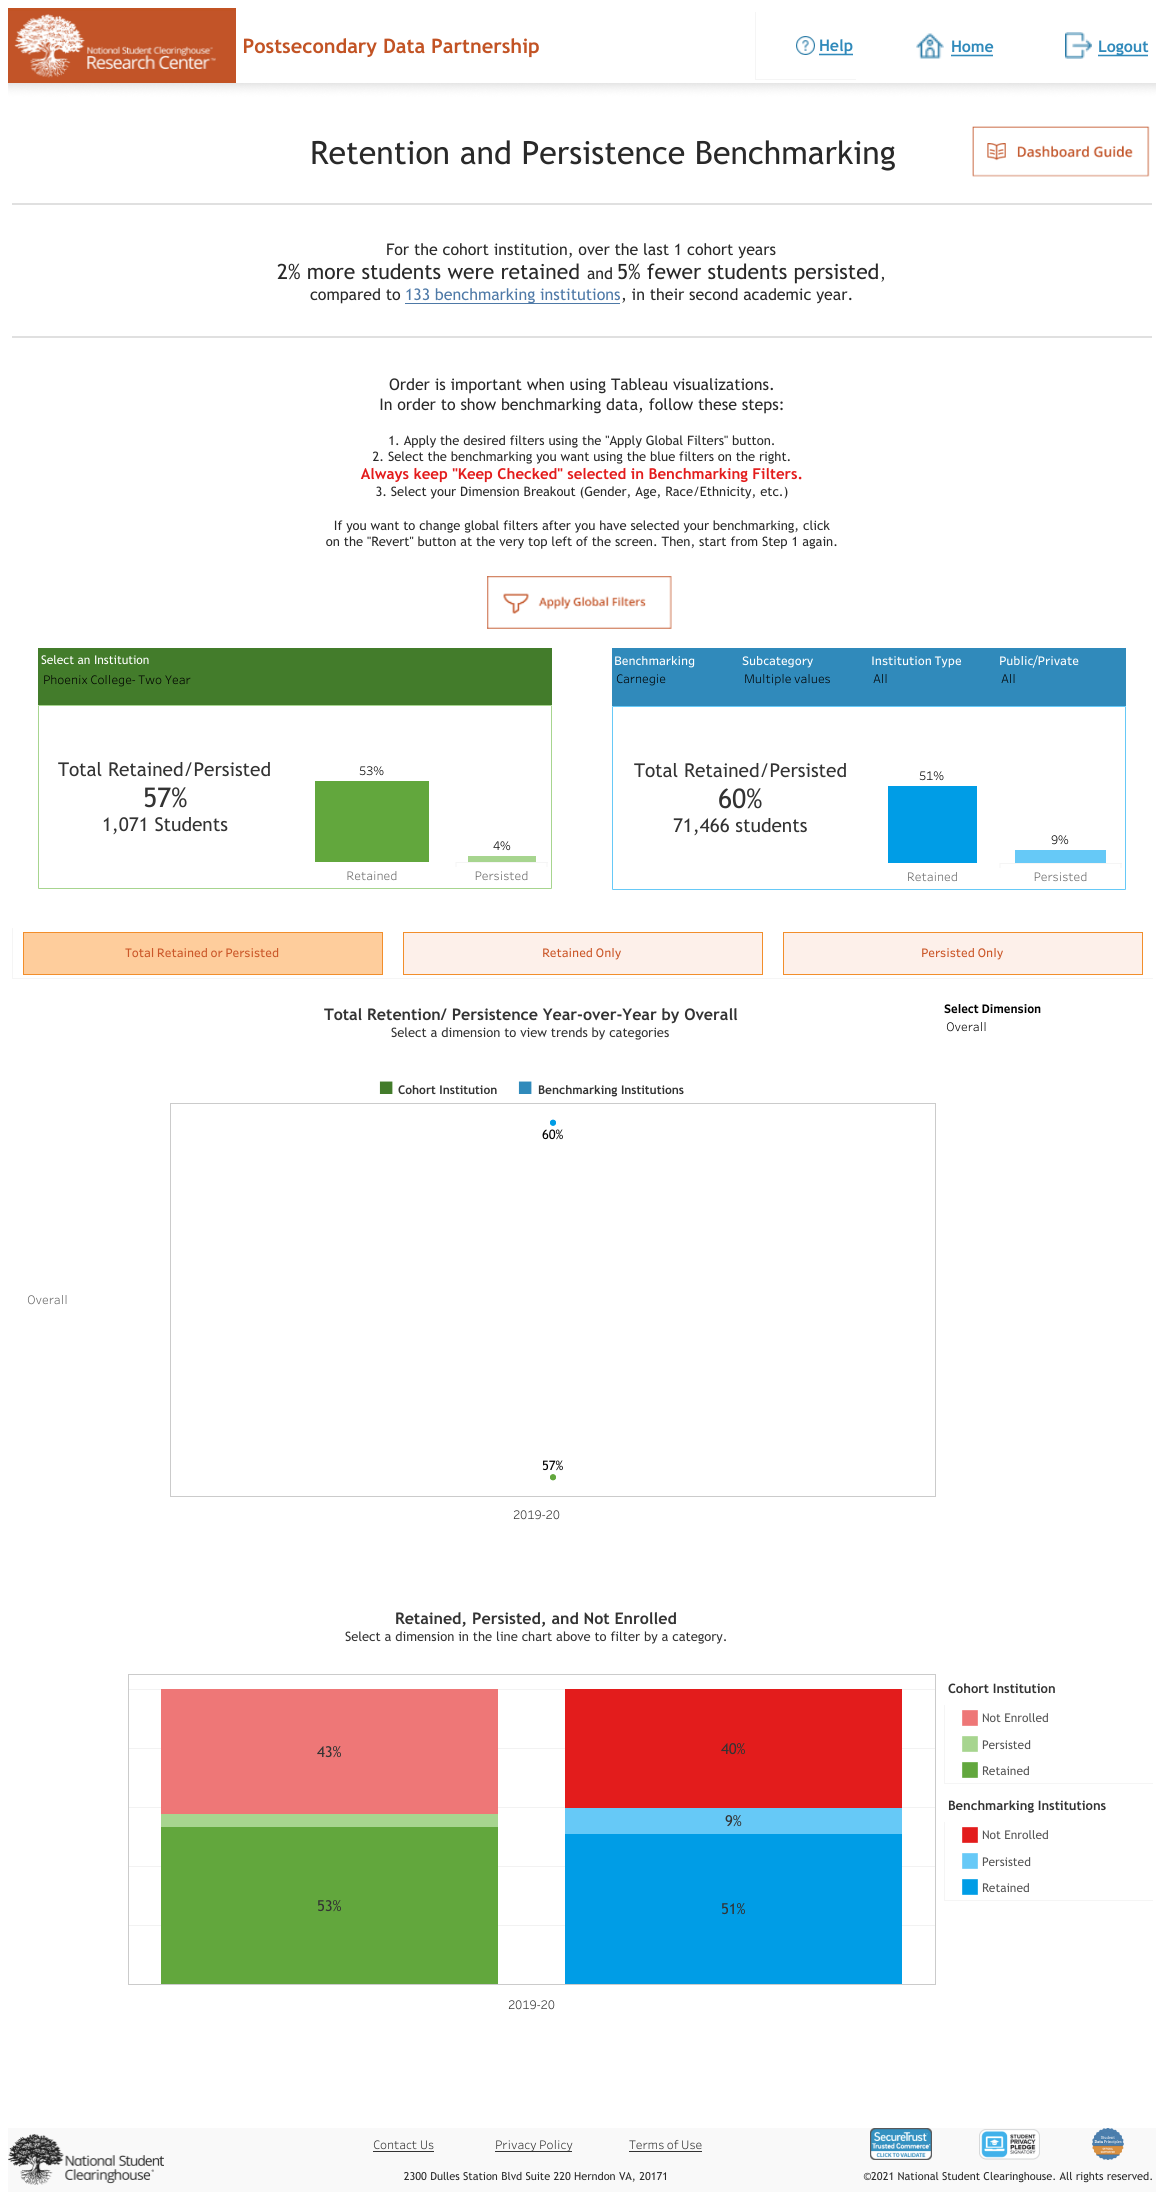
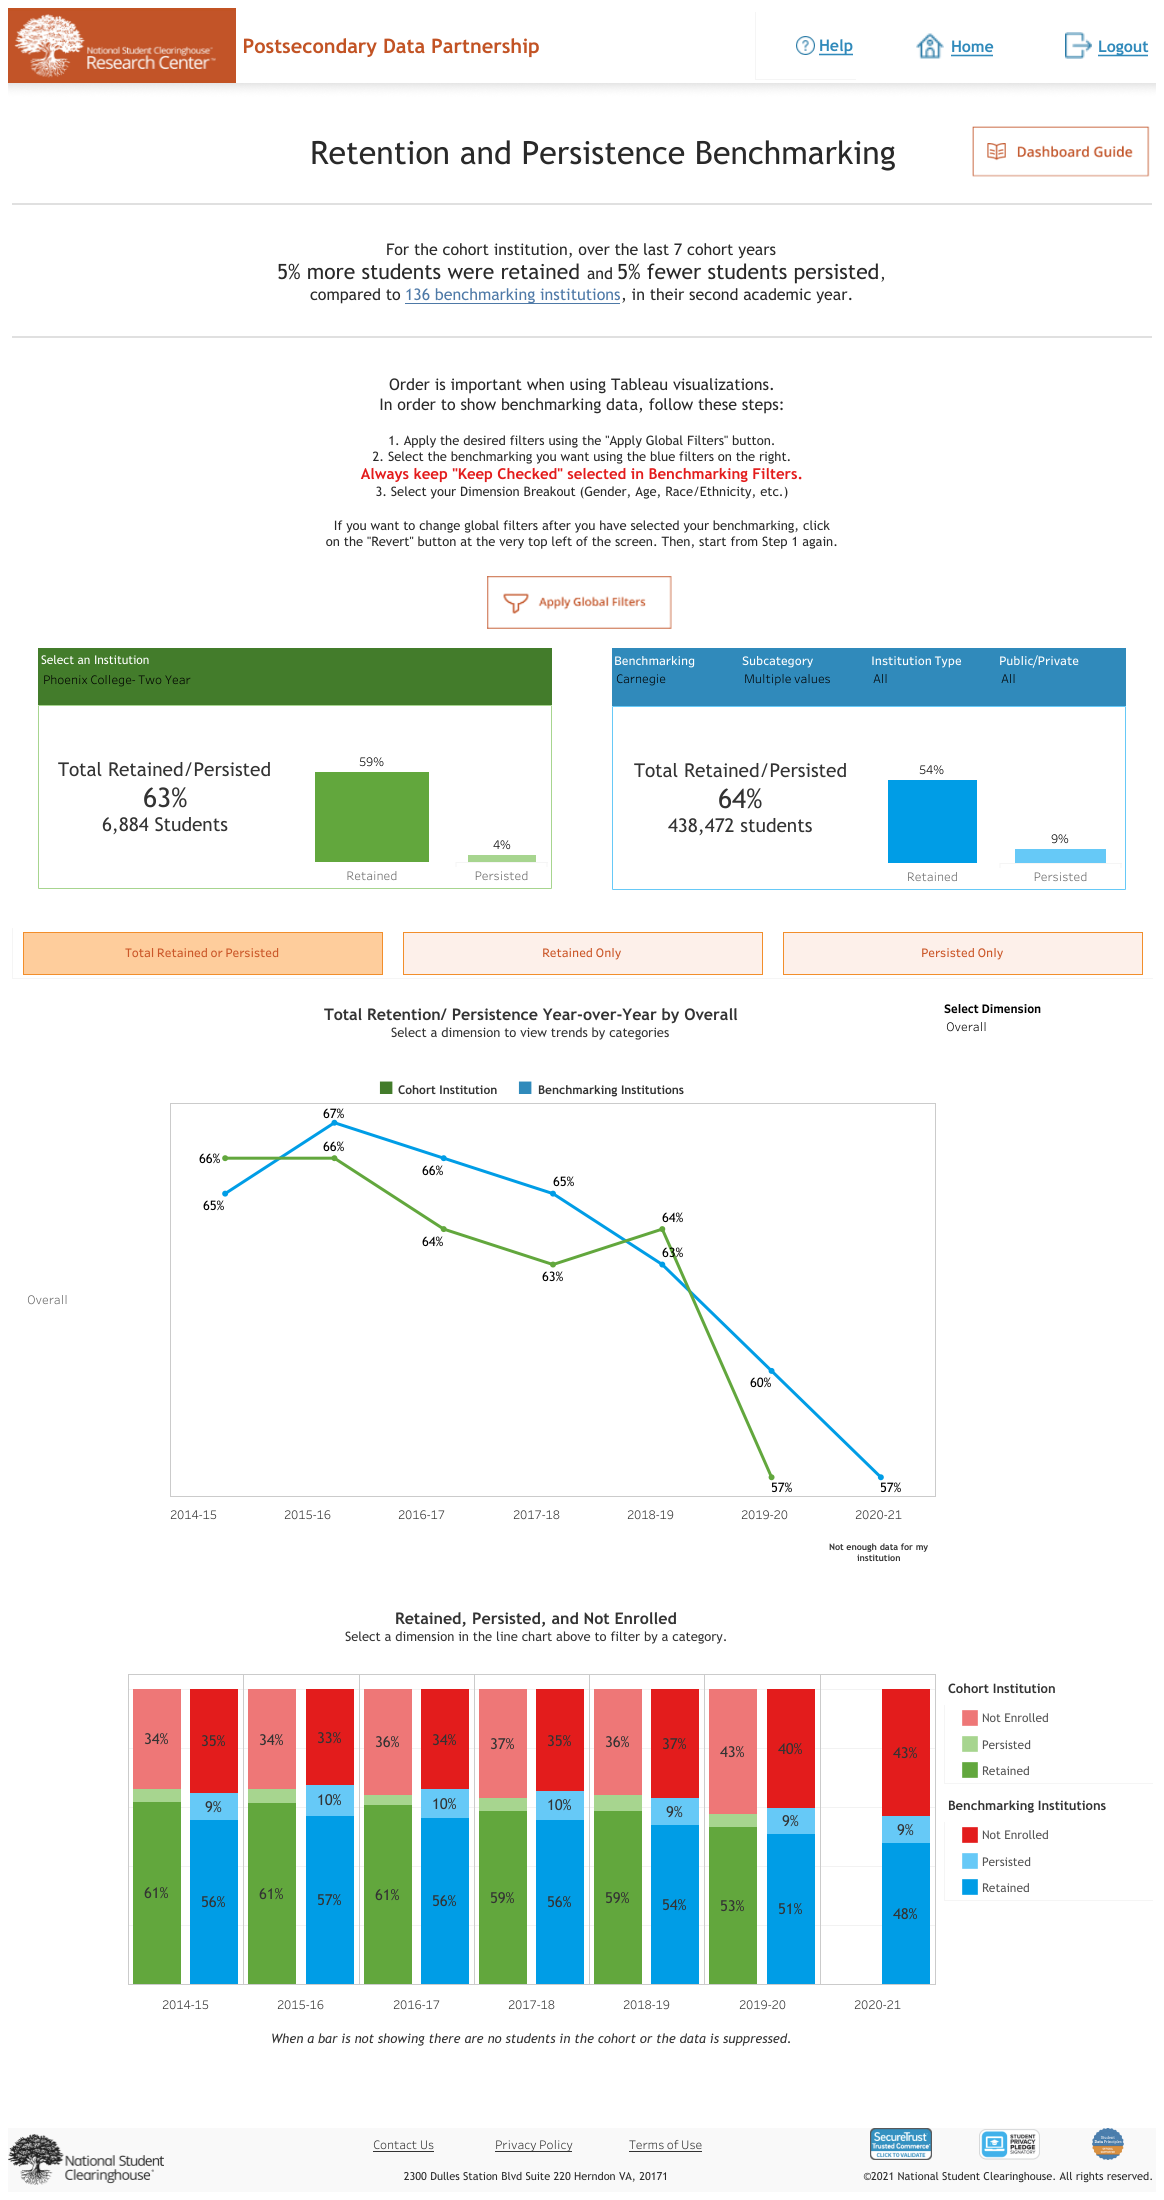
Another top issue is retention. We have experienced declines annually for the past five years in retention, and the PDP metrics demonstrate how we compare to our peers. So, the analysis helped us correct a space where we were not seeing the kind of progress that we wanted to see. That is where the power of the data came in; we are now using data that indicates where our biggest gaps are to drive our strategies for student campaigns and intervention.
What was it like before these reports were available to you, and what it’s like now with your planning efforts?
We have a district-wide goal to focus on equitable completion, which requires consistent, timely, and reliable data. It’s critical to understand where students are being left behind, particularly from a diversity, equity, and inclusion (DEI) perspective. We have found that traditionally underserved students graduate at nearly seven to eight percentage points lower than our traditionally well-served students.
The fact that we can also benchmark at the level of population segments that capture the DEI perspective makes a huge difference because we can see that we have a problem with first generation-student retention. We can then determine if this is a shared problem or if it is something where we can identify institutions that are doing it well, figure out how they did things differently, and learn from them. A tool like the PDP opens these opportunities for us.
How significant is this data for your work and Maricopa?
Given that a few of our revenue streams rely on our enrollment numbers, our organization naturally fixates on headcount enrollment numbers. However, our annual Governing Board Monitoring report focuses on holistic student outcomes. Having the opportunity to sit in front of our governing board with completion outcomes, talking about credit momentum, college-level course success, and what it used to look like compared to where it is today, and how our interventions have mattered is priceless.
The data makes the “whole” student real for our governing board. Instead of just looking at enrollment, we can help them understand the correlation between retention and enrollment, providing a wider lens of the economic drivers of what community college means for the county of Maricopa and the state of Arizona.
Did you have any “aha! moments” upon analyzing the PDP data?
When writing our governing board monitoring report, we observed that one of our institutions significantly improved its Native American completion rates, which has been an ongoing challenge across the Maricopa community colleges. We learned that professional development among their staff was what moved the needle in helping these students complete college. So, we asked ourselves: how do we build on that knowledge base? Who are our most underserved and underperforming students in the district? How do we create a model for implementation to address equitable completion across the board?
What’s next in terms of how the data can help Maricopa Community Colleges?
Our focus has been almost entirely around the retention problem. To address this, we have identified a process that we use to track stop-outs annually. We know which students didn’t continue with us or go anywhere else, and we rely on National Student Clearinghouse data for that information.
We want to have intentional outreach to those students to re-engage them. This population is a significant size, so it is an incredible opportunity for Maricopa to figure out how to re-engage them as quickly as possible when they are deciding their plans.
We are in the process of researching factors that are correlated to stopping out so that we can proactively help these students. A recurring finding in our survey research with our students is that personal connection is critical for supporting their persistence and progression. Our data strategy roadmap is focused almost exclusively on proactively identifying the most effective opportunities for creating personalized connections with students with the most need. We will be looking to our PDP data to help guide us in making the decisions to serve these students and help us fulfill our mission.


The PDP data that has become most impactful for us is the early-term retention data and how we look at first-year success rates for our students.
Meredith Warner
District Director, Student Success, Maricopa Community Colleges
Additional Resources:


